
Sports Intelligence in Action
A Governed Intelligence Model of the NHL.
Mammoth Central connects teams, identities, players, games, seasons, schedules, evidence, historical state, and analytical capabilities inside one inspectable sports-intelligence environment.
The model may help interpret the domain. It does not become the system of record.
Independent ConservaTech Networks project. Not affiliated with, endorsed by, or sponsored by the Utah Mammoth, the National Hockey League, or their owners and partners.
Product coverage
A working intelligence environment with visible operating boundaries.
Mammoth Central distinguishes what the system represents, what the capability registry recognizes, what currently executes through validated paths, and what still requires qualification or completion.
League coverage
Current NHL teams represented in the League Matrix.
Dated Matrix SnapshotRegistered analytical skills
Ask Monty skills registered across supported intelligence families.
Capability RegistrySupported language intents
Natural-language requests recognized by the current contract.
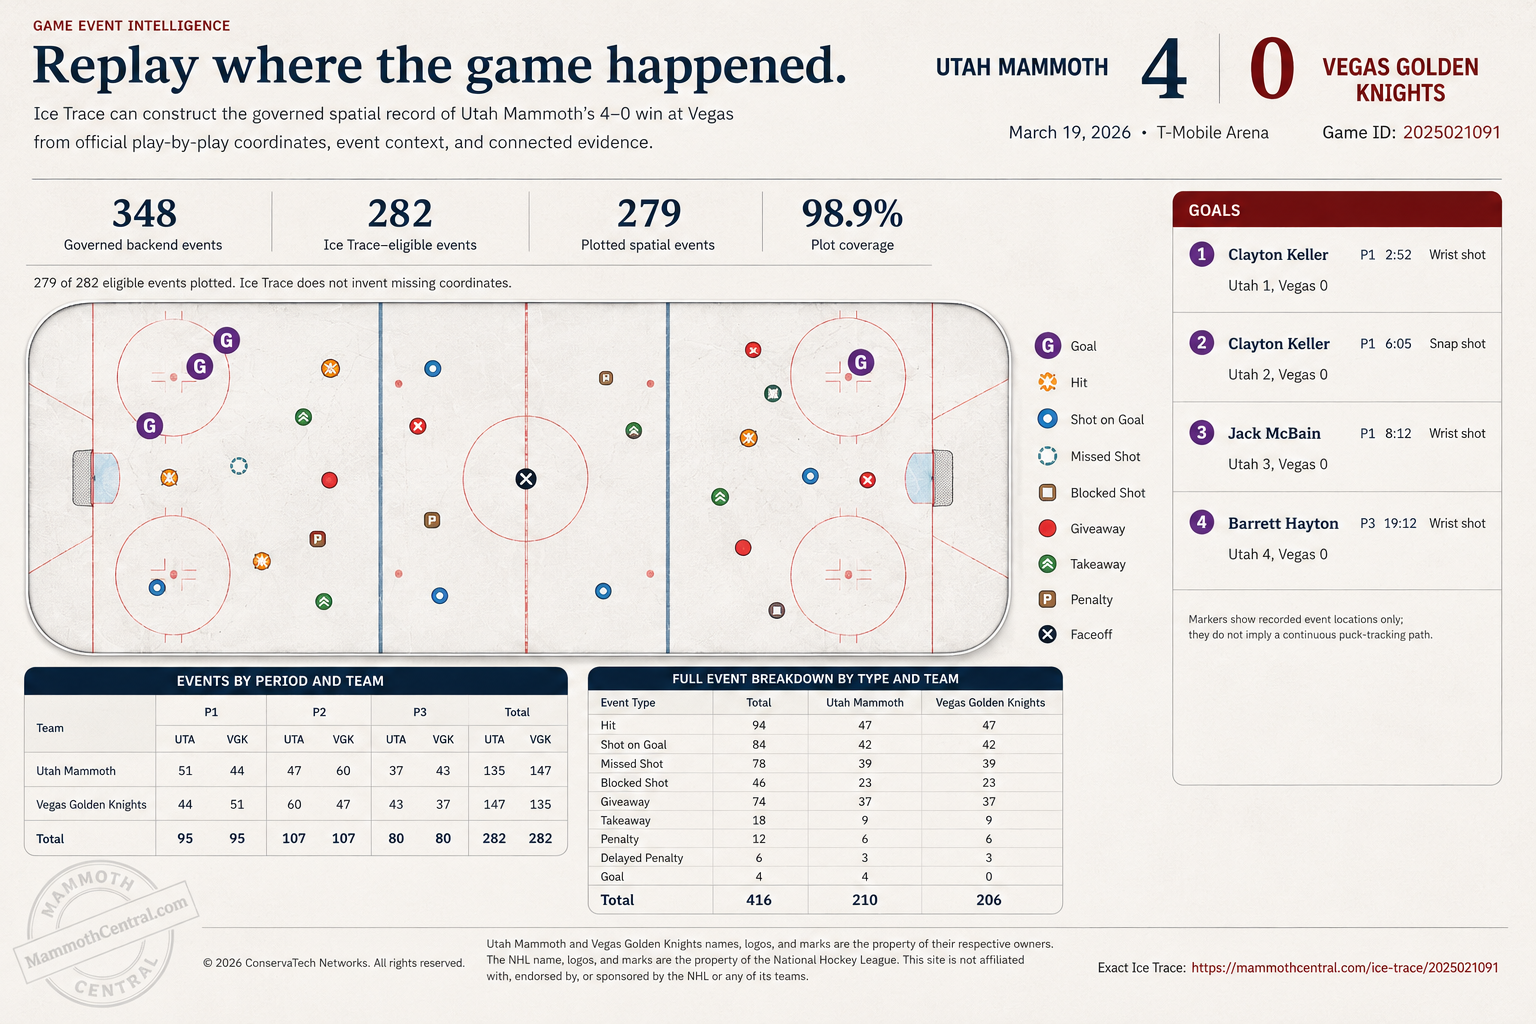
Language ContractSpatial events plotted
Events plotted in the featured Ice Trace game.
Dated Game Export- Represented
- Available in the product model.
- Registered
- Known to the capability registry.
- Executable
- Connected to a working execution path.
- Qualified
- Requires scope, data, or methodology disclosure.
Capability execution coverage
44.4%Executable coverage across the broader registered capability set.Coverage qualification
Registered capability does not automatically mean production-ready. Current operator reporting identifies 44.4% executable coverage across the broader registry. Other capabilities may be registered, planned, partially connected, or awaiting complete execution paths.
Coverage snapshot · Operator registry
Identity and state through time
One connected franchise history. Three governed season states.
Mammoth Central connects the Arizona Coyotes’ 2023–24 season, the Utah Hockey Club’s 2024–25 season, and the Utah Mammoth’s 2025–26 season without collapsing their names, locations, brand states, statistics, evidence, or historical context.
The franchise history remains connected. Each identity and season remains historically specific.
2023–24
Arizona Coyotes
Arizona market and Coyotes brand
Team ID 53
- Points percentage
- 46.95%
- Goals per game
- 3.122
- Goals against per game
- 3.341
- Goal differential
- −18
Validated Team DNA v1 team-season record
Franchise history preserved
2024–25
Utah Hockey Club
First Utah season and transitional club identity
Team ID 68
- Points percentage
- 54.27%
- Goals per game
- 2.939
- Goals against per game
- 3.061
- Goal differential
- −10
Execution: AMX-20260801-DB69C8AEA6
Market and team identity changed
2025–26
Utah Mammoth
Utah Mammoth brand state
Team ID 68
- Points percentage
- 56.10%
- Goals per game
- 3.268
- Goals against per game
- 2.927
- Goal differential
- +28
Execution: AMX-20260801-05EBA9DBB0
Brand state advanced
- Season statistics
- Roster state
- Schedule and games
- Source records
- Methodology version
- Derived analysis
- Historical aliases
Season trajectory
The statistical profile changed across three governed season states.
Points percentage
+9.15 percentage points- 2023–2446.95%
- 2024–2554.27%
- 2025–2656.10%
Improved by 9.15 percentage points across the governed three-season history.
Goals per game
+0.146 goals per game- 2023–243.122
- 2024–252.939
- 2025–263.268
Improved by 0.146 goals per game from 2023–24 to 2025–26, despite a decline during the transitional 2024–25 season.
Goals against per game
0.414 fewer goals allowed per game- 2023–243.341
- 2024–253.061
- 2025–262.927
Improved by allowing 0.414 fewer goals per game. Lower is favorable.
Goal differential
+46 goals- 2023–24−18
- 2024–25−10
- 2025–26+28
Moved from −18 to +28, a net improvement of 46 goals.
Season profiles use validated Team DNA v1 rates and governed team-season records. These changes do not imply causal attribution.
Historical cohort comparison
The team profile moved closer to multiple historical cohorts.
Playoff teams
Strong confidence
Not suppliedAMX-20260801-DB69C8AEA6AMX-20260801-915FC7F4C8+33.8 similarity points
Change from 2023–24 to 2025–26
Division winners
Strong confidence
Not suppliedAMX-20260801-FB977E92EEAMX-20260801-CBB6B502CE+21.3 similarity points
Change from 2023–24 to 2025–26
Stanley Cup finalists
Limited confidence
Not suppliedAMX-20260801-6F29030844AMX-20260801-9016096CE6+25.5 similarity points
Change from 2023–24 to 2025–26
Similarity measures descriptive closeness to the selected cohort medians. It is not a contender rating, playoff probability, championship forecast, or causal model.
Focused cohort inspector
Why the 2025–26 profile was highly similar to the playoff-team cohort.
Points percentage
- Utah Mammoth
- 56.10%
- Cohort median
- 60.68%
Goals per game
- Utah Mammoth
- 3.268
- Cohort median
- 3.396
Goals against per game
- Utah Mammoth
- 2.927
- Cohort median
- 2.9815
Goal differential
- Utah Mammoth
- +28
- Cohort median
- +27.5
Similarity to the selected playoff-team cohort
- Confidence
- Strong
- Cohort sample
- 16 teams
- Reference
AMX-20260801-915FC7F4C8
Why the comparison is possible Mammoth Central can compare these seasons because it knows which identity, season, source record, metric definition, and historical state each value belongs to.
- Canonical franchise
- Historical team identity
- Season state
- Team metrics
- Cohort definition
- Comparison execution
- Inspectable result
Dated operational intelligence
The opening schedule becomes an operating-load model.
Schedule pressure is calculated from home-and-road distribution, travel, back-to-backs, and recovery intervals—not from a generic strength-of-schedule label.
- vs.Chicago Blackhawks
- atColumbus Blue Jackets
- atNew York RangersBack-to-back
- atNew Jersey Devils
- atBoston Bruins
- atBuffalo Sabres
- vs.Toronto Maple Leafs
- atEdmonton Oilers
- vs.Edmonton Oilers
- vs.Pittsburgh Penguins
- Road games
- 6
- Home games
- 4
- Back-to-backs
- 1
schedule-pressure-v1Execution: AMX-20260801-F94CF83442Schedule Pressure is a ConservaTech Networks product methodology, not an official NHL metric. Dates, travel, and recovery calculations may change when the schedule or source data changes.
Deterministic intelligence
Natural-language questions become validated analytical operations.
- Question
- Semantic frame
- Identity and time scope
- Capability validation
- Deterministic executor
- Evidence and methodology
- Structured answer
How did the Utah Mammoth compare with playoff teams in 2025–26?
96.3% similarity
Highly similar · Strong confidence
- Points percentage
- 0.561
- Goals per game
- 3.268
- Goals against per game
- 2.927
- Goal differential
- +28
- Cohort size
- 16
Execution: AMX-20260801-991072F023
Will Utah win the Stanley Cup?
No validated predictive capability is available.
Mammoth Central returns a non-answer instead of generating a plausible prediction.
The sports system proves patterns used across enterprise intelligence.
Team and franchise identity
Customers, business units, subsidiaries, mergers, and organizational lineage
Player identity
Employees, consultants, contractors, vendors, and licensed professionals
Roster state
Staffing, assignments, responsibility, and workforce history
Season and game state
Projects, engagements, releases, incidents, and operating periods
Statistics and records
Financial, operational, delivery, quality, and performance measures
Sports evidence
System-of-record data, approvals, audit records, documents, and revision history
The domain changes. The architecture does not.
Canonical identity, temporal state, evidence, computation, governed workflows, and inspectable conclusions are reusable enterprise patterns.